


When people ask me what I do as a digital marketer, I always struggle to condense everything I do in a simple phrase. The answer I am testing lately though is this: “I am optimizing the experience in websites so that it’s easier for users to convert as consistently as possible”.
It still sucks as an explanation to an “outsider”, I know.
I mean, what does “optimize an experience” mean in that context and how do you do that?
I’ll try to explain in the next 1.000 words.
I’ll present the process I’ve been implementing lately, inspired by the Conversion Optimization Minidegree by cxl.com.
Why do we need such a process?
First of all, websites are not built in an optimal way. The structure, the user flow, the menus, the visuals, the texts, the architecture… they all need minor or major tweaks, and they will perform better (more sales, more leads, more engagement).
One way to approach this is to use your experience and gut feeling on what adjustments would work better, and then implement them.
Sadly, what works in one website does not always work in others, because user behavior is highly contextual.
So it is always a gamble. If you can afford gambling with your website, that’s an OK strategy. However, 9 out of 10 businesses, cannot.

We need another method.
We need data from the website that will give us the context to act for that specific website.
But what data should you look for and how can you obtain them?
The following process describes exactly that.
Step #1: Heuristic Analysis
The first step is to see what happens on the “surface”, where users are.
Heuristic Analysis is an “experience-based assessment of your website”. That means that you have to walk through the website page by page and assess each page on the following important factors:
- Clarity: Is the content / offer on this page as clear as possible? How can we make it clearer, simpler?
- Friction: What on this page is causing doubts, hesitations and uncertainties? What makes the process difficult? How can we simplify? We can’t reduce friction entirely, we can only minimize it.
- Anxiety: Is there something that causes your users’ guard go up? Maybe you’re asking for too much sensitive information? Maybe your website looks scammy?
- Distraction: What’s on the page that is not helping the user take action? Is anything unnecessarily drawing attention? If it’s not motivation, it’s friction – and thus it might be a good idea to get rid of it.
- Relevancy: Does the page meet user expectation – both in terms of content and design? How can it match what they want even more?
- Value: Is it communicating value to the user? Can we do better? Can we increase user motivation?
After going through every page and assessing them on these factors, you’ll surely have tons of ideas on what you should change about how the website looks and feels.
Step #2: Technical Analysis
In many cases, a website might look perfect on the surface but still not convert. That might be due to technical issues. A professional should go through the user experience and check if everything works correctly, search for technical bugs and fix them.
That could involve things like
- Website doesn’t work on a certain browser (or certain version of a browser)
- Website looks awesome on desktop but breaks on mobile
- Links and buttons that don’t work
- Speed of the website is too low.
- Integration with 3rd party tools is broken (eg. if you have forms that connect to your email marketing tool)
Step #3: Digital Analytics Analysis
The first purpose of a digital analytics analysis is to discover where the friction point is for the customers and see at which pages or actions they get stuck. Once we identify those points, we can modify or remove them.
The second purpose of a digital analytics analysis is to discover correlations of user behavior with certain patterns. Maybe you’ll discover that
- people who come through your Facebook Ads convert better than the ones coming from Google Ads.
- women purchase the first time they visit, while men do the 2nd or 3rd time
- 90% of your customers, make a product search before they buy
All these are examples of insights you can get from your Google Analytics (or other Analytics tools), based on which, you can get ideas of how to optimize.
Needless to say that you have to have set up your Analytics tool correctly.
Sadly, most websites have a broken analytics configuration, so they cannot measure a lot and thus are unable to get valuable insights.
Step #4: Qualitative Surveys
Until now we’ve been just observing our visitors. With qualitative surveys we directly ask them about their experience on the website. It is important to get original insights by focusing on open ended questions.
On-site surveys
You can use tools like Hotjar to create short, non-intrusive surveys in certain pages to get insights on either the specific pages or the whole website experience. They may add friction to the user experience but they can provide valuable information you can act upon. Ask ideally 1-3 open-ended questions that focus on their fears, doubts & hesitations. That should be a good starting point to learn about what causes friction in your website (apart from your survey :P).
Customer surveys
These are surveys for your actual buyers. You could send email surveys directly to the inbox of your first-time buyers. Ask them about their purchase, and the friction they experienced in the buying process. The response rates will be much higher than for the on-site surveys. After 100-200 responses you have more than enough data to start acting, as the response patterns will repeat themselves over and over after that point.
Step #5: User Testing
This is another type of survey, where you actually observe the user while they are using your website, going through the buying process and performing various tasks. These people should ideally be part of your target audience, but most times any person will do if it is not you or from your organization (too biased).
Where can you find these people?
You can do it with your friends and acquaintances, but you can also recruit them via websites like usertesting.com.
The way it works it you give those people a scenario (eg “find a birthday present for your girlfriend” or “find a pink long skirt size S” or “complete a purchase”). You record the process and observe where they got stuck the most and where they needed extra help or had questions.
The concept is to observe what they do, because what they “say” and “do” don’t always overlap.
Step #6: Mouse Tracking Analysis
Mouse tracking analysis can provide valuable insights into viewing and information processing patterns. Specialized software like Hotjar can give you the ability to that:
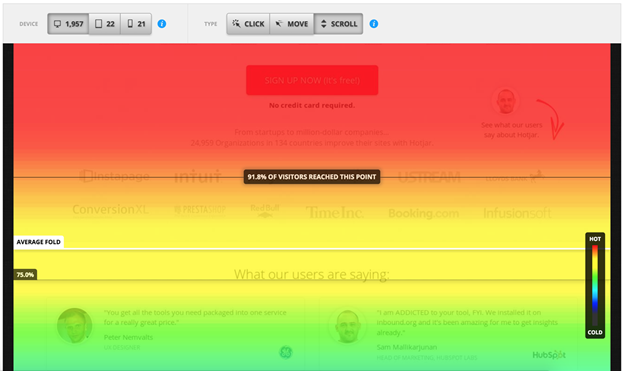
Scroll tracking
Gives you an idea how far down users are scrolling in each page. Maybe that important section should be moved further up the page because nobody sees it there? Scroll tracking could give you an answer to that.
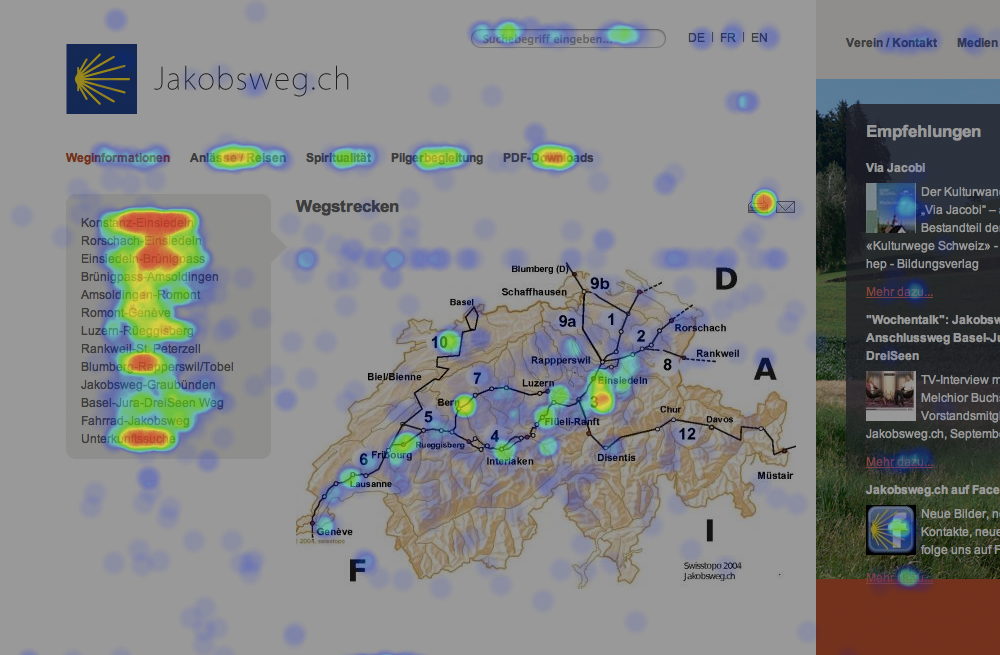
Click maps
What areas of the page get the most clicks? What is the most clicked element on my page? How many clicks does my Call-To-Action get compared to other elements? With heatmaps you can get all these information visually in an instant, just by looking at the screenshot.
User recordings:
This feature resembles user testing a bit. With user recordings you can observe actual screen recordings of people using your website. You don’t have all the context of course, but it’s extremely useful as a tool because you are witnessing the real thing. Spending a couple of hours observing these recordings will give you tons of new insights about how people are using your website.
Step #7: Put everything together in a master action sheet
Alright, you did your research, you found a whole bunch of stuff that needs optimizing.
What’s next?
Time to start implementing of course…
But where do you start from?
This is why you need to put everything together in a master action sheet and prioritize.
There are different ways to prioritize of course, like the PIE and ICE methodologies as well as the PXL Framework.
They all involve grading your suggested optimizations along various parameters. You should choose the model that fits your needs after doing a bit of research and prioritize according to how each suggestion scores.
And, that’s it! You now have a very simple optimization framework to get start getting insights and implementing stuff.